Neuroscience is a new field driven by technological advances that are of mutual importance to the medical, health and science technology sectors — and they are impacting on humanity in nearly every way imaginable.
As scientific knowledge becomes increasingly accessible, closer scrutiny of techniques allows researchers to clarify and validate the quality of research used to inform legislation and medical best practice. It is an inevitability of the scientific process that subsequent research may negate historical precedent, and it turns out that numerous domains of neuroscience are marred by publication bias – especially true for neuroimaging of complex psychological conditions.
To explain this, let’s look at some early computational theories of the brain and then see how similar concepts are utilized within neuroimaging software used to quantify data. With this information we can explain where previous research may have misrepresented findings, also how better methods can be applied moving forward.
An influential model is the Sparse Distributed Memory, where brain activity is represented topologically, similar to a 2 dimensional checker board, where each grid square represents neurons in an area that either have or haven’t fired, rather like an I/O binary switch where black indicates some minimal threshold signal, I: this may seem simplistic, but it turns out to be rather accurate – and ‘bottom-up’ visual processing is in fact topological as light enters the retina, through to the optic fibers feeding information forward to higher cognitive processes:

In this example: a sparse matrix where 20% of the pattern is a random noise and the signal can still be inferred through some residual error.
On the other hand, given sufficient noise a true signal may be mis-inferred or reconstructed to other mental representations:

Images: Rogers, 1988. See also Pentti Kanerva, 1988
These concepts are also compatible to computational language theory, eg TRACE word retrieval, priming and Chomskyan Language Acquisition, highly influential to the fields of psychology and neuroscience, simplified into graphemes or phonemes for example:

Image: Widrow & Hoff, 1960
Signal:Noise signal ratio is the essential concept for statistical analysis of neurological processes defined by the simple equation:
Outcome = Model + Error
Furthermore dopaminergic processes which are central to psychological states and addictive systems can be derived from this formula and simplified into the Reward Prediction Error Model:
λ−V
Dopamine response = reward occurred – reward predicted.[1]
[1] Common Addictive substances including alcohol are described by the Rescorla-Wagner Learning Rule for Pavlovian Conditioning (Rescorla & Wagner, 1972). Where Lamda is the maximum conditioned limit of learning and V represents changes in associative strength. Key to this aspect of conditioned learning is that it is not due to the co-occurrence of the Conditioned Stimulus to the Unconditioned Stimulus, but due to the unanticipated strength of the occurrence which indicated sensitivity of the (dopamine) receptors. It is the error in prediction that results in a stronger neural response, followed by neural strengthening.
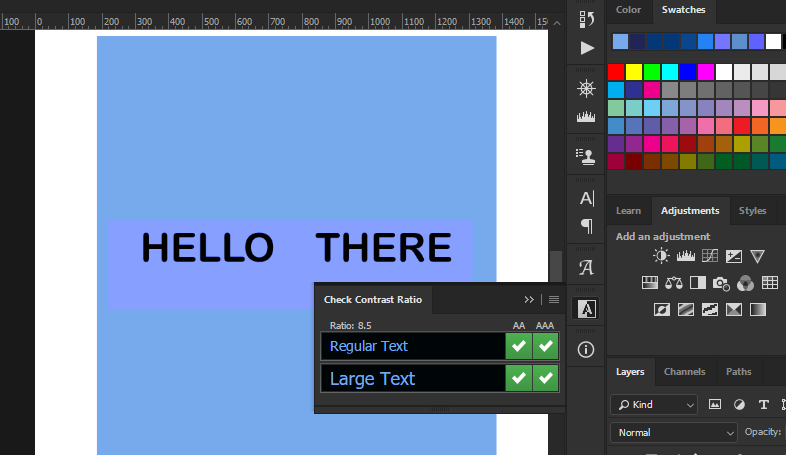
The same is true for colour processing and digital neuroimaging, following the biological limits of human visual processing and thresholds for Just Noticeable Difference according to scale and differentiable stimuli (i.e. color wavelength).

Fourier Analysis is one method for separating wavelengths of varying frequencies, similar to how a signal or color is proverbially extracted from random noise – like static streaming on a TV that is turned on.
Imaging software can produce the same outcome by defining each point in the colour space with a number that can be defined within a range or distance to other colors within 3-dimensional vector space. Following on from that, a value can be defined from an image within a certain range, such as Blue RGB (R:18, G:78, B:230) ± 5, 10 or 15 pixels for example.

Why does this matter? Well, there are a few reasons.
First of all, it demonstrates the limits of human processing that necessitate algorithmic training and digital processing used on images to best infer findings in the first place.
Secondly, because spatial mappings of colors in vector space allow us to code The data in various forms such as linear matrices, to better represent complex patterns that could reveal latent morphological trends hidden in what otherwise appears as a slight, visual randomness.
It is furthermore important for applying threshold limits correctly to the data, rather than according to your subjective aesthetic – which is probably even highly prone to bias with respect to how biased they are considered to be!
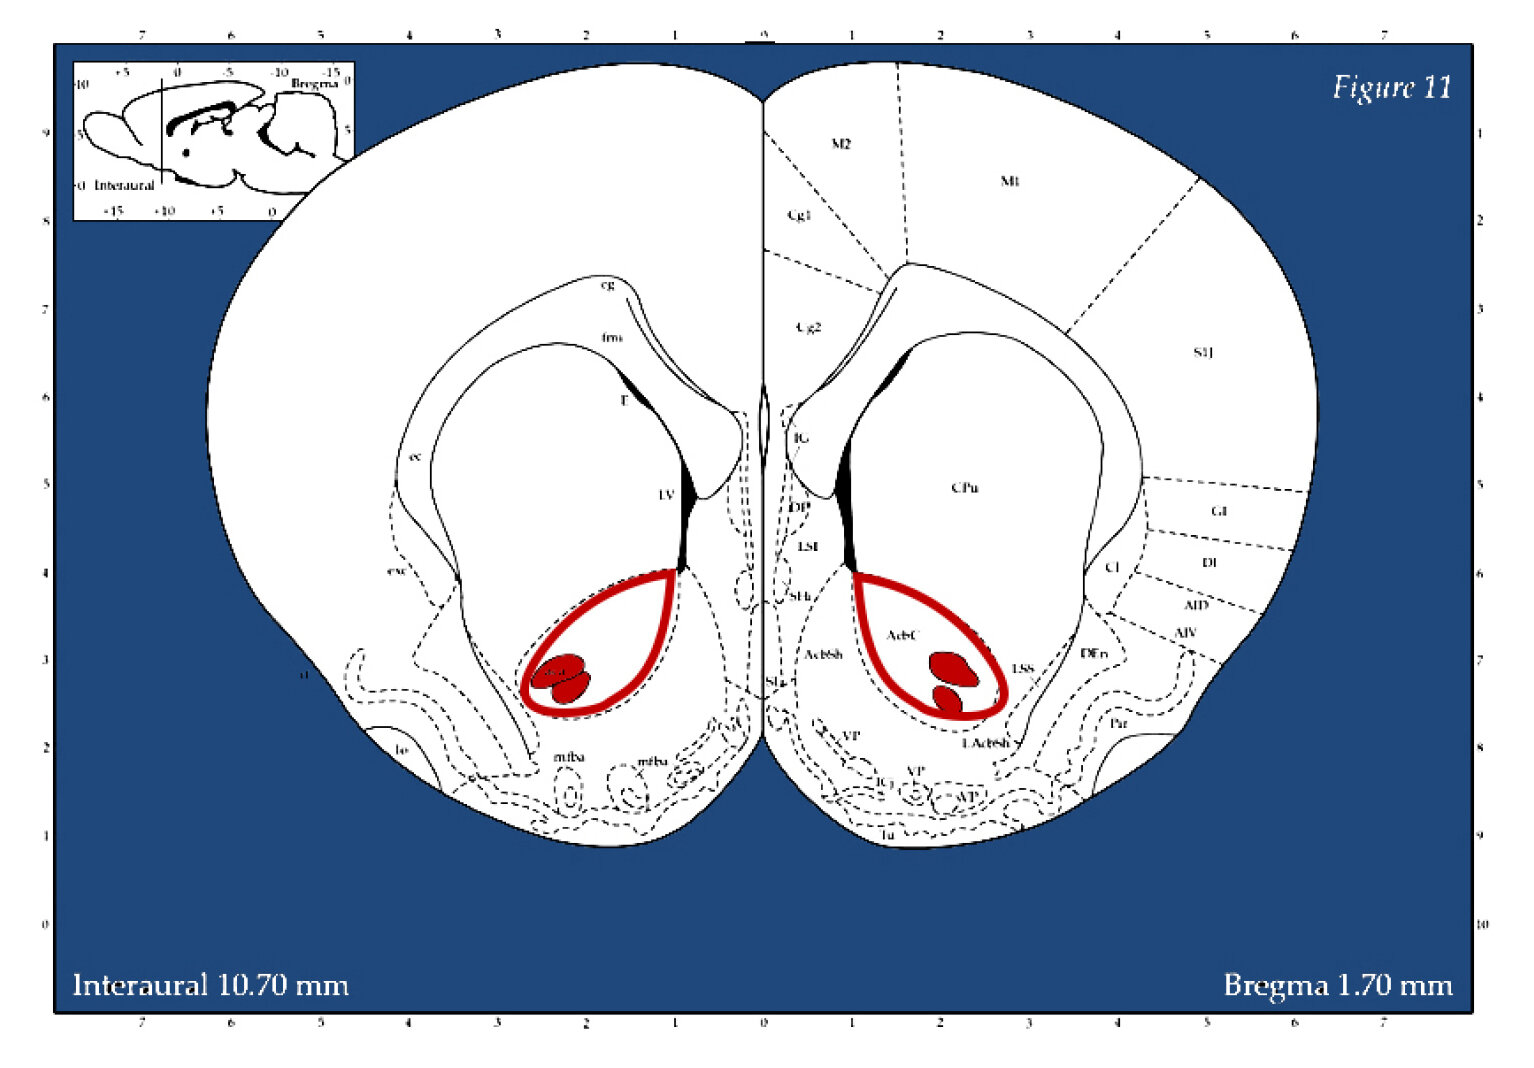
Now let’s consider this information in the context of some research conducted on rats last year, where neural tissue was tagged with a marker to identify activation patterns following exposure to alcohol:

The dark rectangle in the image above is the Nucleus Accumbens Shell, NAcSH region where microphotographs were taken.
(Magnify with mouse)
Above this, an algorithm of uniform distributed noise has been overlayed at increasingly high values in order to determine what the best threshold should be for defining constituted selectable pixel area. Extraneous noise impacts spatial distributions of colourspace. It follows from that, even slight additions of noise can add a considerable falsification to the spatial distribution.
Looking more closely at this now, it is apparent that raw images are needed and they should be taken in a standardised format in order to make inferences.
(Magnify with mouse)
Image top left shows raw microscope file, top right with contrast filter, polarizing extreme values. Bottom left shows thresholding algorithm picking up on tagged nuclei, bright red. Bottom right shows defined regions are ranked/ordered by number.
In this instance, neural counting is based on a defined parameter of what is considered dark pixel space to define and tag a boundary area. Therefore tagging can be arbitrary according to both how closely defined the space must adhere to sphericity as well as what is the limit of diameter in the spherical space. The lower right image identified elements are tagged with a numerical code that can be extracted along with its coordinates and pixel properties into a spreadsheet, where presumably they can be used, in more comprehensive calculated procedures.
Therefore thresholding is not arbitrary to the process of neural analysis and can in fact alter data findings if not adequately defined to prevent image extortion.
Consider for example if photos varied in lighting and contrast due to inevitable smudging on the slides, they would need to be adjusted to be standardized, and some images would have more data clipped than others would.
Ultimately, this means that findings can turn out to be ‘significant’ or ‘not significant’ depending on what level the threshold has been set to.

Data trends can be sufficiently and systematically skewed from these sorts of applications of included-excluded parameters, for example if they coincide with particular regions of interest in the brain and reverse inferences (logical fallacy) are concluded from that, which turns out to happen often in medical neuroimaging publications.
So. Looking at this again more closely, an approach could be as follows:
In an instance such as this where regions within a neuroimage of sorts are being quantified according to a thresholding parameter based within a colorspace, the correct application should first be determined. While manual threshold can be defined based on a test run and then set across all images in a set, it is likely that Automated thresholding is preferable for a number of reasons: Automated thresholds are based on predefined algorithms that have been formulated based on some meta-analysis of pixel and texture properties for the images in question. They are therefore also standardised and may be better compared with other findings and are suitable for meta-analysis where best-practise method has been agreed upon.
Following that rationale, the optimal Automated threshold can be chosen according to some standards such as how a background is classified, and whether a local or global thresholding technique has been defined in that technique. Background can be subject to clamping effects too, where a given range of tones were expressed but get totally blocked out.
A reductive but accurate explanation of pixel sampling is best described as a selection process where the local mean intensity of neighboring pixel boundaries for binary greyscale mapping based are derived based on a lowest-order sample value. Nearest Neighbour Sampling can be thought of as a process of pixel sampling based on inferences of proximity, where the process can be used for reductive purposes – downsampling, or for low-fidelity image purposes, or to ‘smooth out’ degraded images through extrapolating in more pixels to construct a high-fidelity image.

Knowing this, a number of Auto thresholds can be tested first, to asses which will have the closest values and smallest standard deviation to an optimal – but not standardised manual threshold check. Essentially, the algorithms tag neighbouring pixels according to slightly different patterns and degrees of freedom, where some will be more optimal for blocking out the background.
High fidelity images are therefore important because they have a greater bit-depth range, e.g. 8-bit (28 = 256) pixel depth range and medical imaging applications often require over 10 or 12-bit sampling as a standard to reduce rounding errors in computations and extraneous compression factors, that may possibly misrepresent results.

Such images could be reprocessed as 16-bit (816 = 65,536) pixel depth range to ensure that no algorithmic misreadings occurred, as it can’t be precluded that
thresholding algorithms could vary accordingly by automated counts.
Based on this understanding of preliminary image analysis, we may look more closely at a range of statistical possibilities for data inferences. For example to examine classified pixel groups, or for higher dimensional clustering and pattern regressions in ‘broad spectrum’ pattern data sets where there may be latent subgroupings. Shape analysis can be defined more clearly in the colorspace to compare topological differences between groups such as age and sex, where again, looking for patterns.
Spectral composition is especially important in ‘noisy signal images’ where some Tones are algorithmically excluded but may have been legitimate and therefore reduced the total – and relative count of included elements.
A final point of interest would be to consider Principal Component Analysis in the context of neuroimaging, given the points already made. It may be the case that factor groupings of various elements may vary or overlap depending on how thresholding has saturated pixels, where it is possible that some ranges or texture components are not uniformly classified.
Current research: The interest for all of this is to apply best practise imaging analysis and digital accessibility standards to the field of neuroscience and digital neuroimaging within the broader context of scientific accessibility and veracity.
This is especially important in such a burgeoning field where various conflicts of findings and methodologies are expected and clear communication of theory and outcomes are indispensable . The applications discussed here extend further into human neuroimaging applications like MRI, CAT and PET imaging, emphasising that simple oversights can turn out to be nontrivial Visual science in all of its forms are perhaps the most accessible medium for conveying information succinctly, underscoring emphasis to patients seeking insight for their various states and neurological conditions.
Finally, the outcome from all of this would be to achieve reliable, valid & exacting findings — as well as certified top cream science.
References
Kanerva, P. (1988). Sparse Distributed Memory. MIT Press.
Rogers, D. (1988) Kanverva's Sparse Distributed Memory: An Associative Memory Algorithm well-suited to the Connection Machine. RIACS Technical Report 88.32, Research Institute for Advanced Computer Science NASA Ames Research Center.
Widrow, B., Hoff, M.E. (1960). Adaptive Switching Circuits. Office of Naval Research Centre: Stanford Electronics Laboratories. Technical Report No. 1553-1.
Rescorla, R. A., & Wagner, A. R. (1972). A theory of Pavlovian conditioning: Variations in the associability of stimuli with reinforcement. Classical conditioning: II. Current theory and research, 64-99.